In our rapidly evolving digital landscape, the ability to visualize and interpret data in real-time has become not just valuable, but essential. At the forefront of this revolution stands the live map – a dynamic, interactive tool that is fundamentally changing how we perceive, interact with, and utilize geographic information. This powerful technology is not only transforming business operations but also reshaping our understanding of the world around us in profound ways.
What is a Live Map?
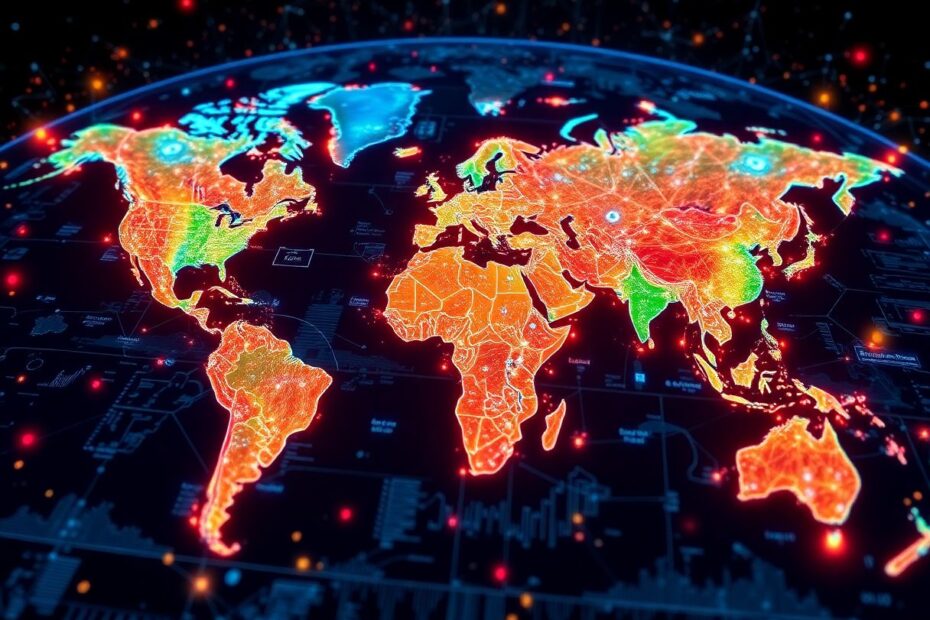
A live map is an interactive, real-time visualization of data on a geographic interface. Unlike traditional static maps, live maps offer a dynamic representation of changing information, updating continuously to provide the most current data available. These versatile tools can display a wide array of information, from traffic patterns and weather conditions to social media activity and business transactions.
Key Features of Live Maps:
- Real-time updates: Data refreshes automatically, often within seconds, providing up-to-the-minute information.
- Interactivity: Users can zoom, pan, click, and manipulate elements to reveal more detailed information.
- Multi-layered data: Various data sets can be overlaid on a single map for comprehensive insights and analysis.
- Customization: Maps can be tailored to display specific types of information relevant to the user's needs or interests.
- Integration capabilities: Live maps can often be integrated with other software and platforms for enhanced functionality and data synthesis.
The Evolution of Live Maps
While the concept of live mapping isn't entirely new, recent technological advancements have dramatically expanded its capabilities and applications. Let's explore the journey of live maps through time:
- Early days (1960s-1990s): Basic traffic and weather maps on television broadcasts
- Web 2.0 era (Early 2000s): Introduction of interactive online maps like Google Maps and MapQuest
- Mobile revolution (Late 2000s): Widespread adoption of GPS-enabled smartphones, making live maps accessible on-the-go
- Big data integration (2010s): Incorporation of vast amounts of real-time data from multiple sources, including IoT devices
- AI and machine learning enhancement (Late 2010s-Present): Enhanced predictive capabilities and advanced data analysis
Applications of Live Maps Across Industries
The versatility of live maps has led to their adoption across numerous sectors, revolutionizing operations and decision-making processes. Here are some notable applications:
1. E-commerce and Retail
Live maps have become a game-changer in the e-commerce world, offering real-time insights into consumer behavior and sales trends. For instance, Shopify's Black Friday Cyber Monday (BFCM) Live Map offers a real-time visualization of global sales trends, showcasing the scale of transactions and highlighting the impact of independent businesses worldwide.
- Sales tracking: Monitoring sales per minute across different regions, allowing businesses to identify hot markets and adjust strategies in real-time.
- Order visualization: Displaying orders in real-time on a global scale, providing a tangible representation of business activity.
- Environmental impact: Tracking carbon offset amounts from purchases, demonstrating a commitment to sustainability.
2. Transportation and Logistics
In the transportation sector, live maps have transformed route planning, fleet management, and customer service:
- Traffic monitoring: Real-time updates on road conditions, accidents, and congestion help drivers and dispatchers make informed decisions.
- Vehicle tracking: Live location data for fleet vehicles improves efficiency and allows for accurate ETAs.
- Delivery optimization: Dynamic route adjustments based on current conditions reduce fuel consumption and improve delivery times.
For example, companies like UPS use live mapping technology to optimize delivery routes, saving millions of gallons of fuel annually and improving overall efficiency.
3. Emergency Services and Disaster Management
Live maps play a crucial role in coordinating emergency responses and managing disasters:
- Resource allocation: Real-time tracking of emergency vehicles and personnel ensures efficient response to incidents.
- Incident mapping: Visualizing the spread of wildfires, floods, or disease outbreaks helps authorities make informed decisions.
- Evacuation planning: Identifying safe routes and shelters during emergencies can save lives.
During the COVID-19 pandemic, live maps were instrumental in tracking the spread of the virus and coordinating responses globally.
4. Urban Planning and Smart Cities
Cities are leveraging live maps to improve infrastructure and services:
- Public transport optimization: Adjusting schedules based on real-time demand improves service efficiency.
- Utility management: Monitoring energy consumption and water usage helps identify areas for improvement and detect issues quickly.
- Crime prevention: Analyzing patterns and deploying law enforcement resources effectively can reduce crime rates.
Cities like Singapore use live mapping as part of their smart city initiatives, improving everything from traffic management to urban planning.
5. Environmental Monitoring
Live maps are instrumental in tracking and understanding environmental changes:
- Weather forecasting: Visualizing weather patterns and predicting severe events with greater accuracy.
- Climate change analysis: Monitoring long-term environmental trends to inform policy decisions.
- Wildlife tracking: Following migration patterns and protecting endangered species by identifying critical habitats.
Organizations like NASA use live maps to track changes in global temperature, sea levels, and ice coverage, providing crucial data for climate research.
The Technology Behind Live Maps
The power of live maps lies in the sophisticated technology that drives them. Here's a deeper look at some key components:
Geographic Information Systems (GIS): The foundation for creating and managing spatial data. GIS software like ArcGIS and QGIS form the backbone of many live mapping applications.
Global Positioning System (GPS): Provides accurate location data for mapping. The development of more precise GPS technology has greatly enhanced the accuracy of live maps.
Cloud computing: Enables processing and storage of vast amounts of data. Platforms like Amazon Web Services and Google Cloud provide the infrastructure needed for large-scale live mapping operations.
APIs and web services: Allow integration of various data sources and services. For example, Google Maps API and OpenStreetMap API are widely used for creating custom live maps.
Data visualization tools: Transform raw data into comprehensible visual formats. Tools like D3.js and Mapbox GL JS offer powerful capabilities for creating interactive map visualizations.
Machine learning algorithms: Analyze patterns and make predictions based on historical and real-time data. TensorFlow and PyTorch are often used to develop ML models for live mapping applications.
The Impact of 5G on Live Maps
The rollout of 5G networks is set to revolutionize live mapping technology. With its ultra-fast speeds and low latency, 5G will enable:
- Near-instantaneous updates: Reducing lag time in data transmission from seconds to milliseconds.
- Higher data capacity: Allowing for more detailed and complex visualizations, including high-resolution 3D maps.
- Enhanced IoT integration: Connecting more devices and sensors for richer data collection, potentially increasing the number of data points by orders of magnitude.
- Improved AR and VR experiences: Creating more immersive and interactive map interfaces, blending the physical and digital worlds seamlessly.
Challenges and Considerations
While live maps offer numerous benefits, they also present some challenges that need to be addressed:
- Data privacy and security: Ensuring the protection of sensitive information, especially when dealing with personal location data.
- Data accuracy and reliability: Maintaining the quality and trustworthiness of real-time data, which can be affected by factors like sensor malfunctions or network issues.
- Information overload: Balancing detail with clarity in data presentation to avoid overwhelming users.
- Technical infrastructure: Meeting the demands of processing and transmitting large volumes of data, which requires significant computational resources.
- User experience: Designing intuitive interfaces for diverse user groups, ensuring accessibility and ease of use.
The Future of Live Maps
As we look ahead to 2025 and beyond, the potential of live maps continues to expand. Here are some exciting developments on the horizon:
1. Augmented Reality Integration
Live maps will increasingly incorporate augmented reality (AR) technology, allowing users to overlay digital information onto their physical environment. Imagine pointing your smartphone at a street and seeing real-time information about businesses, traffic conditions, and even historical facts floating in your view. Companies like Google and Apple are already investing heavily in AR mapping technology.
2. Predictive Analytics
Advanced AI algorithms will enhance the predictive capabilities of live maps. For instance, traffic maps might not only show current congestion but also forecast traffic patterns hours in advance, allowing for proactive route planning. This could revolutionize fields like urban planning and emergency response.
3. Hyper-Personalization
Live maps will become more tailored to individual users, offering personalized recommendations and insights based on their preferences, behavior, and real-time context. This could lead to more efficient navigation, personalized travel recommendations, and targeted local advertising.
4. Internet of Things (IoT) Synergy
The proliferation of IoT devices will provide an unprecedented wealth of data for live maps. From smart city sensors to wearable devices, this interconnected network will create a more comprehensive and granular view of our world. For example, smart buildings could provide real-time occupancy data, while connected vehicles could offer instant updates on road conditions.
5. Quantum Computing Integration
As quantum computing technology matures, it has the potential to revolutionize live mapping by processing vast amounts of data at speeds unimaginable with classical computers. This could lead to more complex simulations and real-time analysis of global phenomena, potentially transforming fields like climate modeling and pandemic response.
Case Study: Shopify's BFCM Live Map
Let's take a closer look at Shopify's Black Friday Cyber Monday (BFCM) Live Map as an example of innovative live mapping in action:
Global Sales Visualization: The map provides a real-time view of sales trends across the Shopify platform, showcasing the global reach of e-commerce. Users can see sales hotspots light up across the world, offering a vivid representation of consumer activity.
Key Metrics Display: Users can track crucial data points such as sales per minute and orders per minute, offering insights into consumer behavior during one of the busiest shopping periods of the year. This real-time data can help businesses make quick decisions about inventory, pricing, and marketing.
Environmental Impact Tracking: The map also highlights Shopify's commitment to sustainability by displaying carbon offset amounts in real-time. This feature not only raises awareness about environmental issues but also showcases how e-commerce can contribute to sustainability efforts.
Flash Sale Spotlighting: The interactive nature of the map allows users to catch active flash sales, adding an element of excitement and urgency to the shopping experience. This feature can drive engagement and boost sales for participating merchants.
Platform Scale Demonstration: By showcasing the collective success of over 1 million independent business owners, the map illustrates the power and reach of the Shopify ecosystem. This visual representation can be a powerful marketing tool for Shopify, demonstrating the platform's global impact.
The BFCM Live Map is more than just a visualization tool; it's a testament to the power of live mapping in creating engaging, informative, and actionable insights from real-time data.
Conclusion: The Transformative Power of Live Maps
Live maps have evolved from simple visualizations to powerful tools that shape our understanding of the world and drive decision-making across industries. As technology continues to advance, the potential applications of live maps are boundless.
From enhancing business operations and improving urban planning to aiding in disaster response and environmental conservation, live maps are at the forefront of our data-driven future. They offer a unique blend of real-time insights, predictive capabilities, and interactive experiences that are transforming how we interact with geographic information.
As we move towards an increasingly connected and data-rich world, live maps will play a crucial role in helping us navigate complexity, make informed decisions, and respond swiftly to changing conditions. The future of live mapping is not just about visualizing data; it's about creating a more responsive, efficient, and interconnected global community.
Whether you're a business owner looking to optimize operations, a city planner aiming to improve urban services, or simply a curious individual seeking to understand the world better, embracing the power of live maps can provide you with valuable insights and a deeper understanding of the dynamic world around us.
As we look to the future, one thing is clear: live maps will continue to evolve, innovate, and shape our perception of the world in ways we're only beginning to imagine. The journey of live mapping technology is far from over, and the most exciting developments may still lie ahead. By staying informed and engaged with this technology, we can all play a part in shaping a more connected, efficient, and responsive world.